San Francisco Tops 2026 List of Most Expensive U.S. Cities
By Morgan Blake. Apr 15, 2026
San Francisco Claims the Top Spot Again
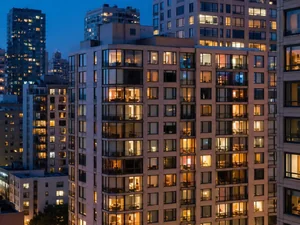
San Francisco has the most expensive rental market in the United States in 2026, with average monthly rents reaching approximately $3,830 – more than twice the national average, according to analysis from TurboTenant using data from Zillow and the U.S. Department of Housing and Urban Development. New York City and Boston round out the top three most expensive markets, with both cities recording average rents above $3,500 per month.
The national average sits at approximately $1,843 per month. That gap between the most and least expensive markets reflects a rental landscape that varies dramatically based on geography, local job markets, and housing supply constraints.
California Dominates the Upper End
California cities account for six of the ten most expensive rental markets in the country, according to the TurboTenant analysis. Irvine, San Jose, and San Diego all rank near the top of the national list alongside San Francisco. The state’s combination of high-income demand, restrictive zoning, and limited housing inventory continues to push rents upward even as growth has slowed from pandemic-era peaks.
San Francisco’s tech sector remains a key driver. According to TurboTenant’s reporting, AI company expansion and the return of office workers have sustained demand in a market that was briefly expected to soften following a pandemic-era exodus.
The Most Affordable Markets Tell a Different Story
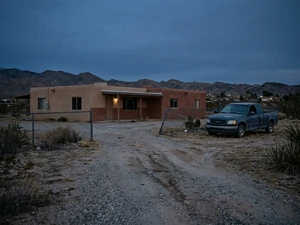
At the other end of the spectrum, cities like Toledo, Wichita, and Tulsa maintain average rents near or below $1,200 per month – roughly one-third the cost of renting in San Francisco, according to the data. These Midwest and Southern markets benefit from lower land costs, less regulatory friction on new development, and slower population growth relative to coastal metros.
Construction Coverage’s analysis of HUD Fair Market Rent data found that the year-over-year increase in rents nationally has decelerated from a peak of 8.7% in early 2023 to approximately 3.5% by late 2025. While the pace of increases has cooled, renters in high-cost cities continue to absorb the compounding effects of earlier surges.
Why the Gap Keeps Growing
Market analysts point to a structural mismatch between housing supply and demand in the nation’s most expensive cities. Rising development costs, strict zoning regulations, and limited available land constrain new construction in cities where demand remains strongest. Boston, for example, lacks rent control laws, which according to TurboTenant has contributed to sustained price pressure even as supply gradually increases in other metros.
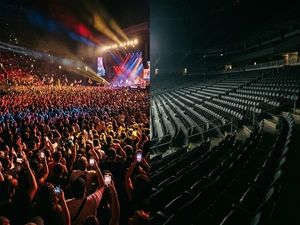
The national rental vacancy rate has climbed back to approximately 7% – a return to pre-pandemic levels – which has cooled the rate of new rent increases. But for renters already living in the country’s most expensive markets, the accumulated cost of previous rent hikes remains a significant financial burden regardless of the current pace of change.
What the Data Means for Renters
The 2026 rankings confirm a pattern that has persisted for years: location is the single largest variable in what Americans pay for housing. A renter in San Francisco is paying the equivalent of four Tulsa rents for the same month. For those with geographic flexibility, the data continues to make a quantifiable case for relocation. For those without it, the rankings offer a clearer picture of where the housing cost burden falls most heavily across the country.
References: The 10 U.S. Cities Where Rent Is Skyrocketing in 2026 | Cities With the Most Expensive Rents
The News Command team was assisted by generative AI technology in creating this content
Trending

Read More

Read More

Read More

Read More

Read More

Read More

Read More

Read More

Read More

Read More

Read More

Read More

Read More
Read More

Read More

Read More

Read More
Read More

Read More

Read More

Read More
Read More

Read More

Read More